First of all, sorry. I am using google translation to ask questions. If someone can answer for me, thank you very much.
I switched to Hive OS today for my mining. This is a good experience. But I have encountered some problems in hopes that someone can help me.
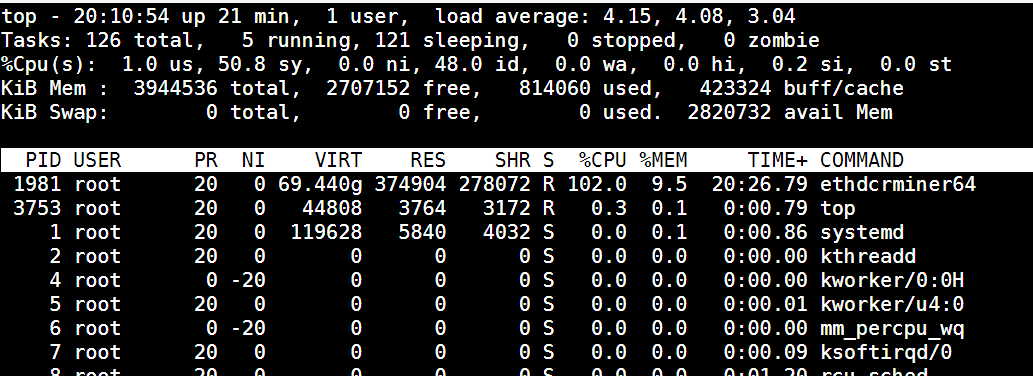
1: High CPU load
I mostly refer to the previous parameter settings when using Win10. However, the High CPU load displayed on the Hive OS is quite high. I tried to fine-tune my overclocking parameters. However, the reduced efficiency is quite limited. Do not know where the problem is.
2:Hashrate
Similarly, about Hashrate. I refer to the previous parameter settings when using Win10. The average rate displayed in the past has mostly 280 MH/s. However, in the current Hive OS, the average speed has dropped. Is this normal, or are there other ways to increase Hashrate?
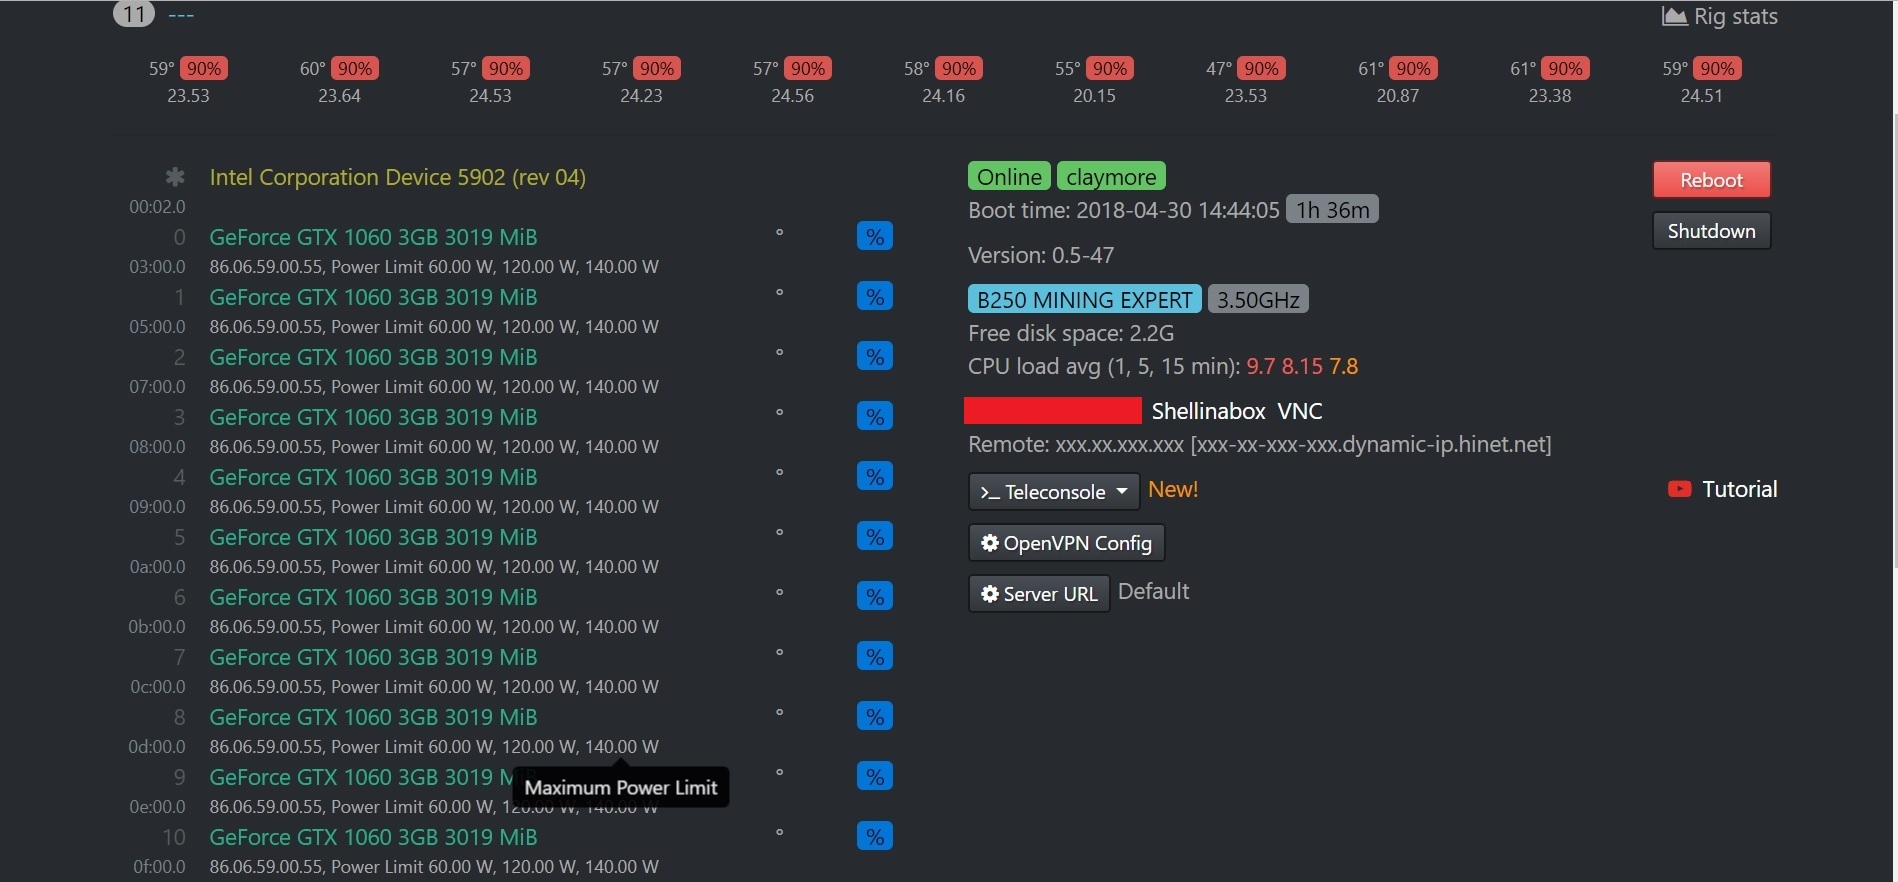
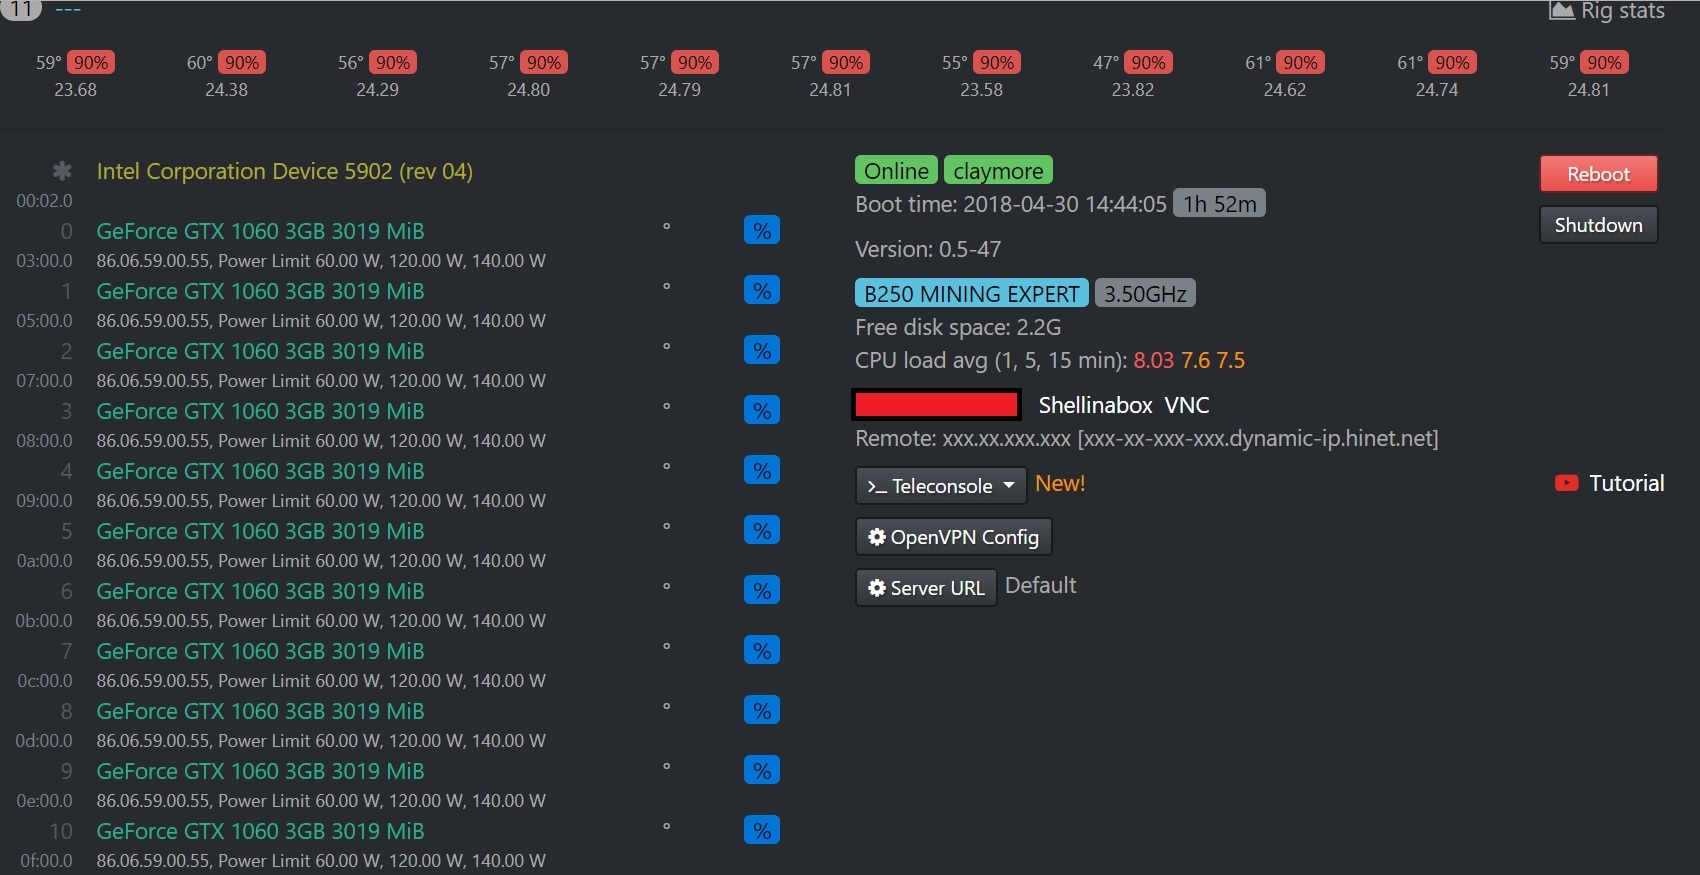
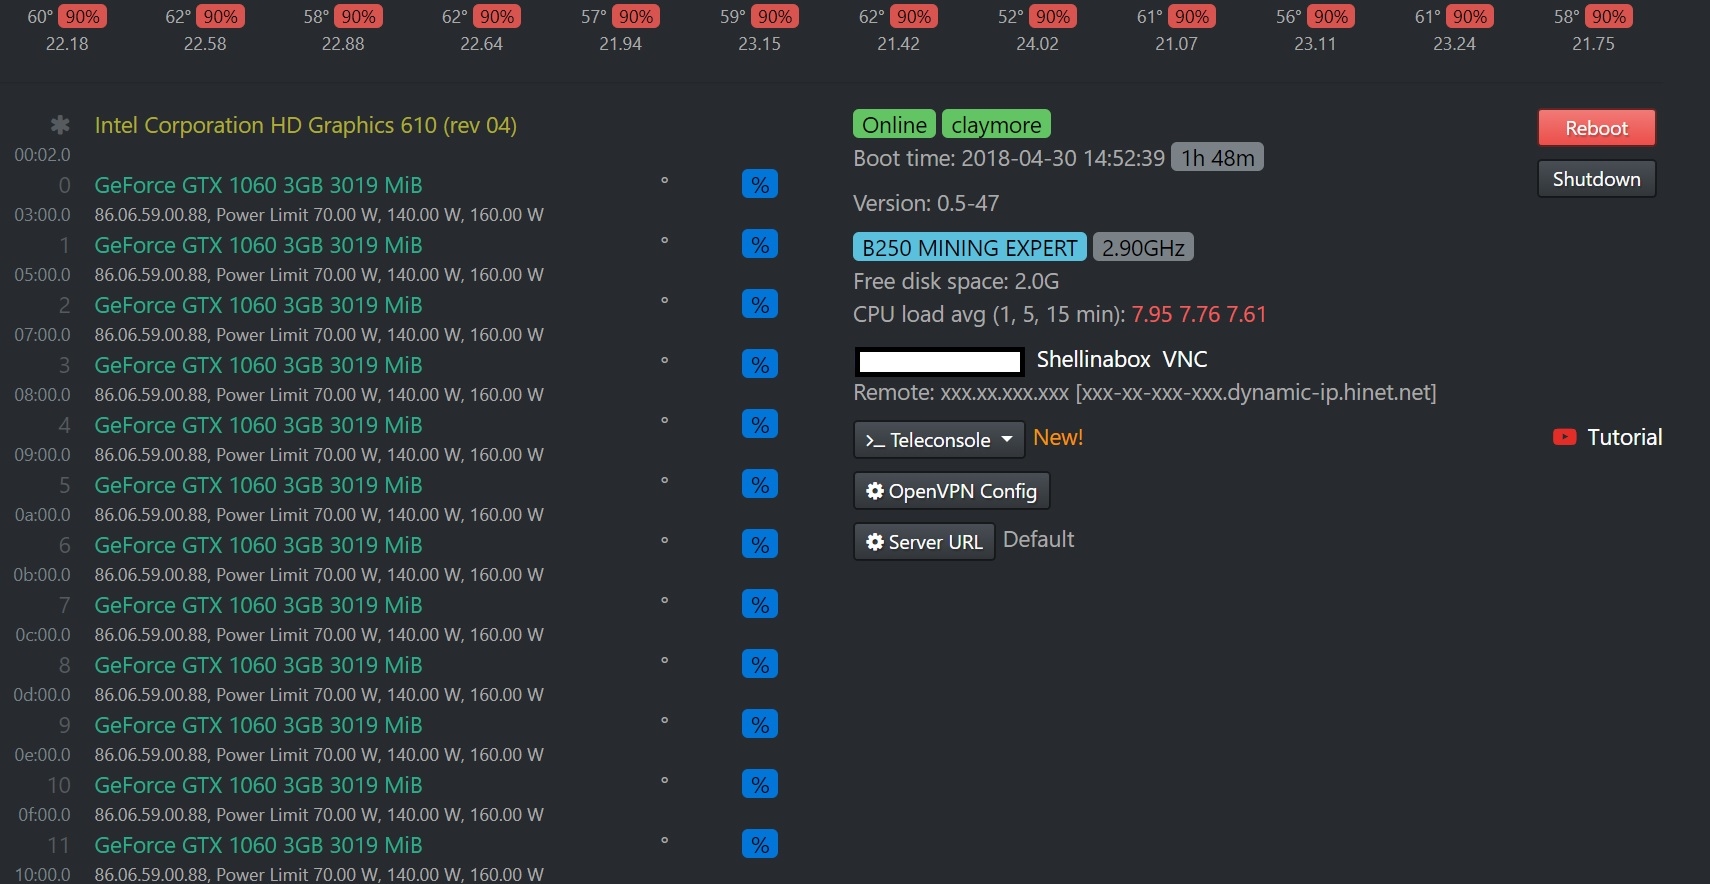
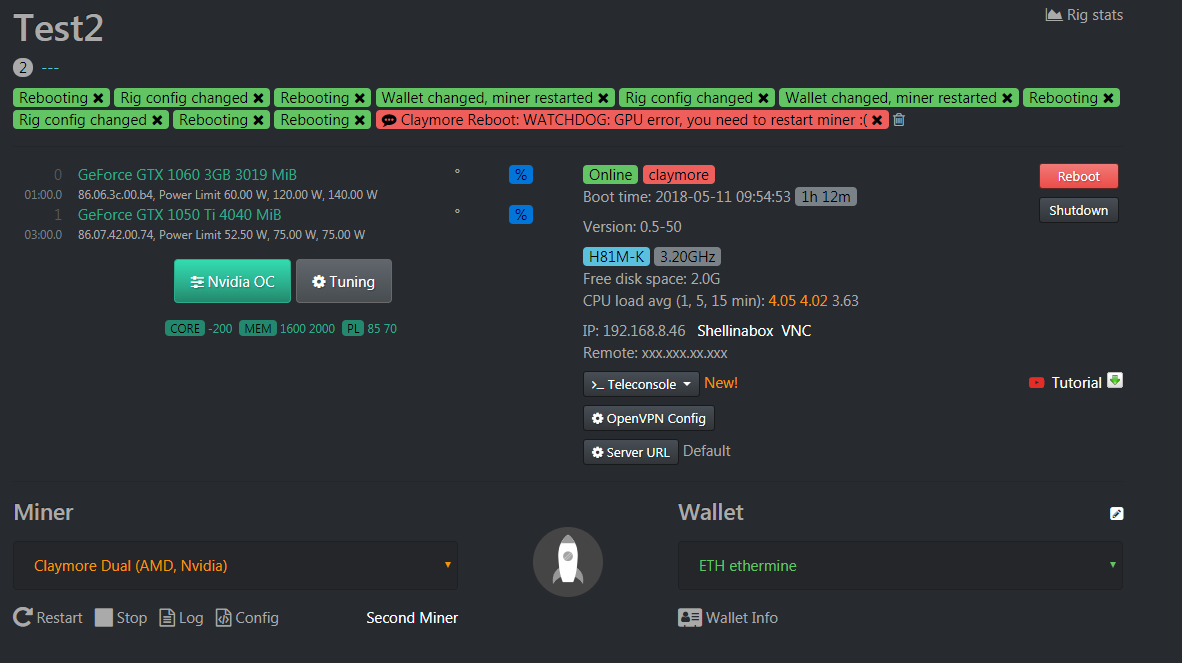
Finally, the drawing shows a simple illustration of the four units currently in operation. Thank you for being able to read it here, and hopefully someone who knows Hive OS better will be able to help.
Seems as though your PL is too low, I ran into similar trouble and increasing PL fixed it. A low PL was resulting in many threads having high CPU usage, including kworker, nvidiasettings, and ethdcriminer64.
According to your suggestion, I tried to increase the PL to 80. I found that Hashrate has obviously improved and it came to 290.
This is great. Thank you for your suggestion.
But as a test machine, the CPU load is still a bit high.
CPU load avg (1, 5, 15 min): 5.98 5.85 3.73
I guess this may be due to the fact that the fan adjustment value is at 90.
However, recent high temperatures are above 30 degrees Celsius
I also worry that the low fan speed will cause the machine’s operating temperature to be too high.
Anyway, thank you very much for your suggestion. I will further observe this side.
thank you very much
P.S: This is a GOOGLE translator. There may be something strange about grammar. Sorry.
Observing so far.
Will still appear: CPU load avg (1, 5, 15 min): 8.37 8.42 8.53
Current settings: CORE -100 MEM 1700 FAN 90 PL 80
PL tried to adjust to: 85
Continuous observation
Memory looks high, 1700 is pretty aggressive. No reason to underclock core.
I’d do +0 core, +1500 mem, 85w power limit, and see if that resolves the CPU load. When you run top from the command line, what processes are taking up the CPU?
Thank you for your suggestion.
I am currently testing
CORE -100 MEM 1700 FAN 90 PL 85 (Group 1)
Or
CORE 0 MEM 1700 FAN 90 PL 85 (Group 2)
These two setting parameters can effectively increase Hashrate.
But I found that applying the second set of values, the operation of the two machines will cause instability.
(A total of four are considered for testing)
One of the most stable settings is: CORE -100 MEM 1700 FAN 90 PL 85.
But applying it to other machines will cause instability, which is really a headache.
I’m trying to find out each value that can [low temperature] [lower power consumption] [higher Hashrate] [stable].
Increasing the voltage can effectively solve the high CPU load conditions. I’m testing MEM 1700~1500, which is the highest stability, and will test PL80~85, MEM 1500~1700, CORE -100~+100 slowly.
Which one can meet the relatively good efficiency of my machine.
Thank you very much for your advice.
For the option of viewing CPU-intensive programs, I will observe the setting parameters and confirm the status of the CPU program.
Thank you again for your suggestions. The status of follow-up observations will still be shared here.
I hope my experience can help people who also have such troubles
P.S: This is GOOGLE’s translation. If there is grammatical weirdness, please excuse me.
Seems maybe PL did not fix it, this problem came back today. Other posts indicate it is some sort of problem with the nVidia driver and interrupts, etc. Hopefully someone from Hive can chime in.
The OhGodAnETHlargementPill option was discovered today in the Nvidia OC setup.
I wonder if anyone can briefly mention what the main function is.
The current test setting parameter is MEM 1600 FAN 90 PL 85.
There is a sense that using this setting parameter is not bad.
Try to apply this value to other machines for observation.
Continuous observation
P.S: This is a GOOGLE translation. If you feel strange grammar, please forgive me.
A problem has recently occurred. Some problems may arise on some machines.
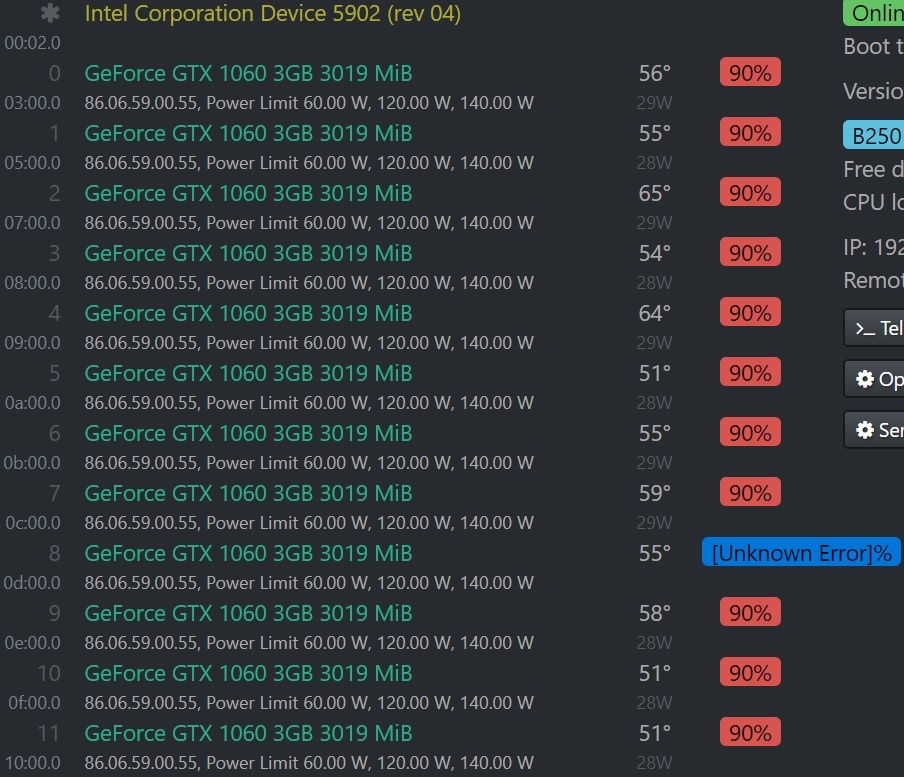
On the 12-card machine, there is a condition where the fan of the graphics card is displayed as Fan = 0%.
The following error message appears when using gpu-fans-find
ERROR: Error assigning value 0 to attribute ‘GPUTargetFanSpeed’
(jga012:0[fan:8]) as specified in assignment
‘[fan:8]/GPUTargetFanSpeed=0’ (Unknown Error).
ERROR: Error resolving target specification ‘fan:11’ (No targets match target
Specification), specified in assignment ‘[fan:11]/GPUTargetFanSpeed=0’.
However, during the actual observation of the operation of the machine, it was found that all the display card fans are in continuous operation.
Is it when I stop the miner and enter the gpu-fans-find command
Should all fans stop completely?
I found that when I enter the gpu-fans-find command, 1 to 2 of the graphics card fans will still run
[quote=“Mishka;3312”]CPU LOAD 105%!!
что интересно с 3 1050ti все нормально. стоит добавить 1060 3гб[/quote]
I try to increase my PL value.
This was helpful at the time to stabilize my machine.
(includes CPU load avg)
At the moment I am still observing whether my settings are more stable.
Do you want to try to increase the PL value first?
P.S: This is a GOOGLE translation. If you feel strange grammar, please forgive me.
P.S 2: My GOOGLE TRANSLATOR has no way to translate your text so that I can understand what it really means. I can only make guesses. I am sorry if I understand it wrong.